

Overview
An end to end data platform for your project’s entire data needs.
Tupaia is a data platform that allows you to collect information about any entity, aggregate it with other data sources, build beautiful analytics and reports, then disseminate, map and visualise it – all in one place. It has highly granular permissions structures, supports multiple data hierarchies and it brings your data together in award-winning, mapping-led visualisations that will blow you away.
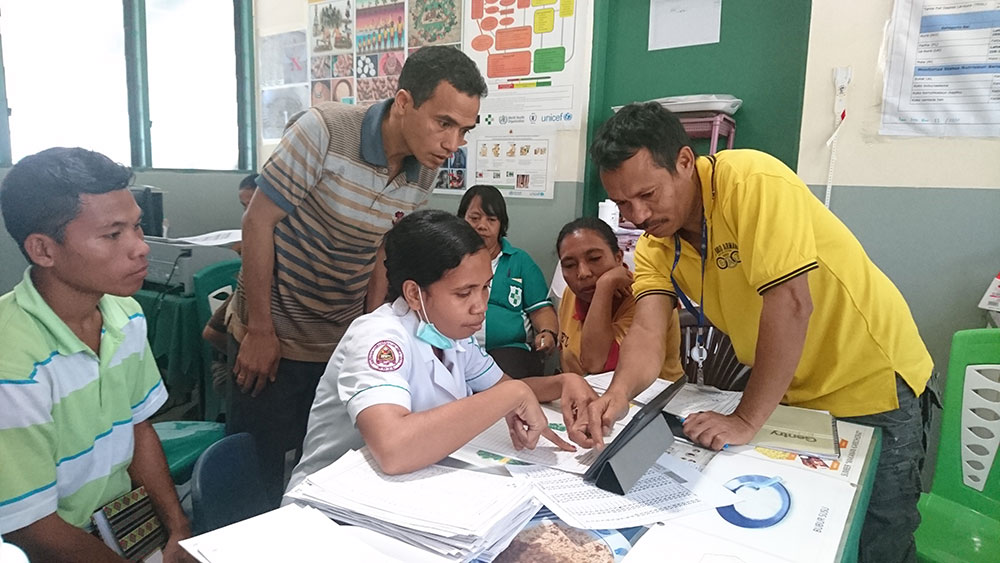
The app
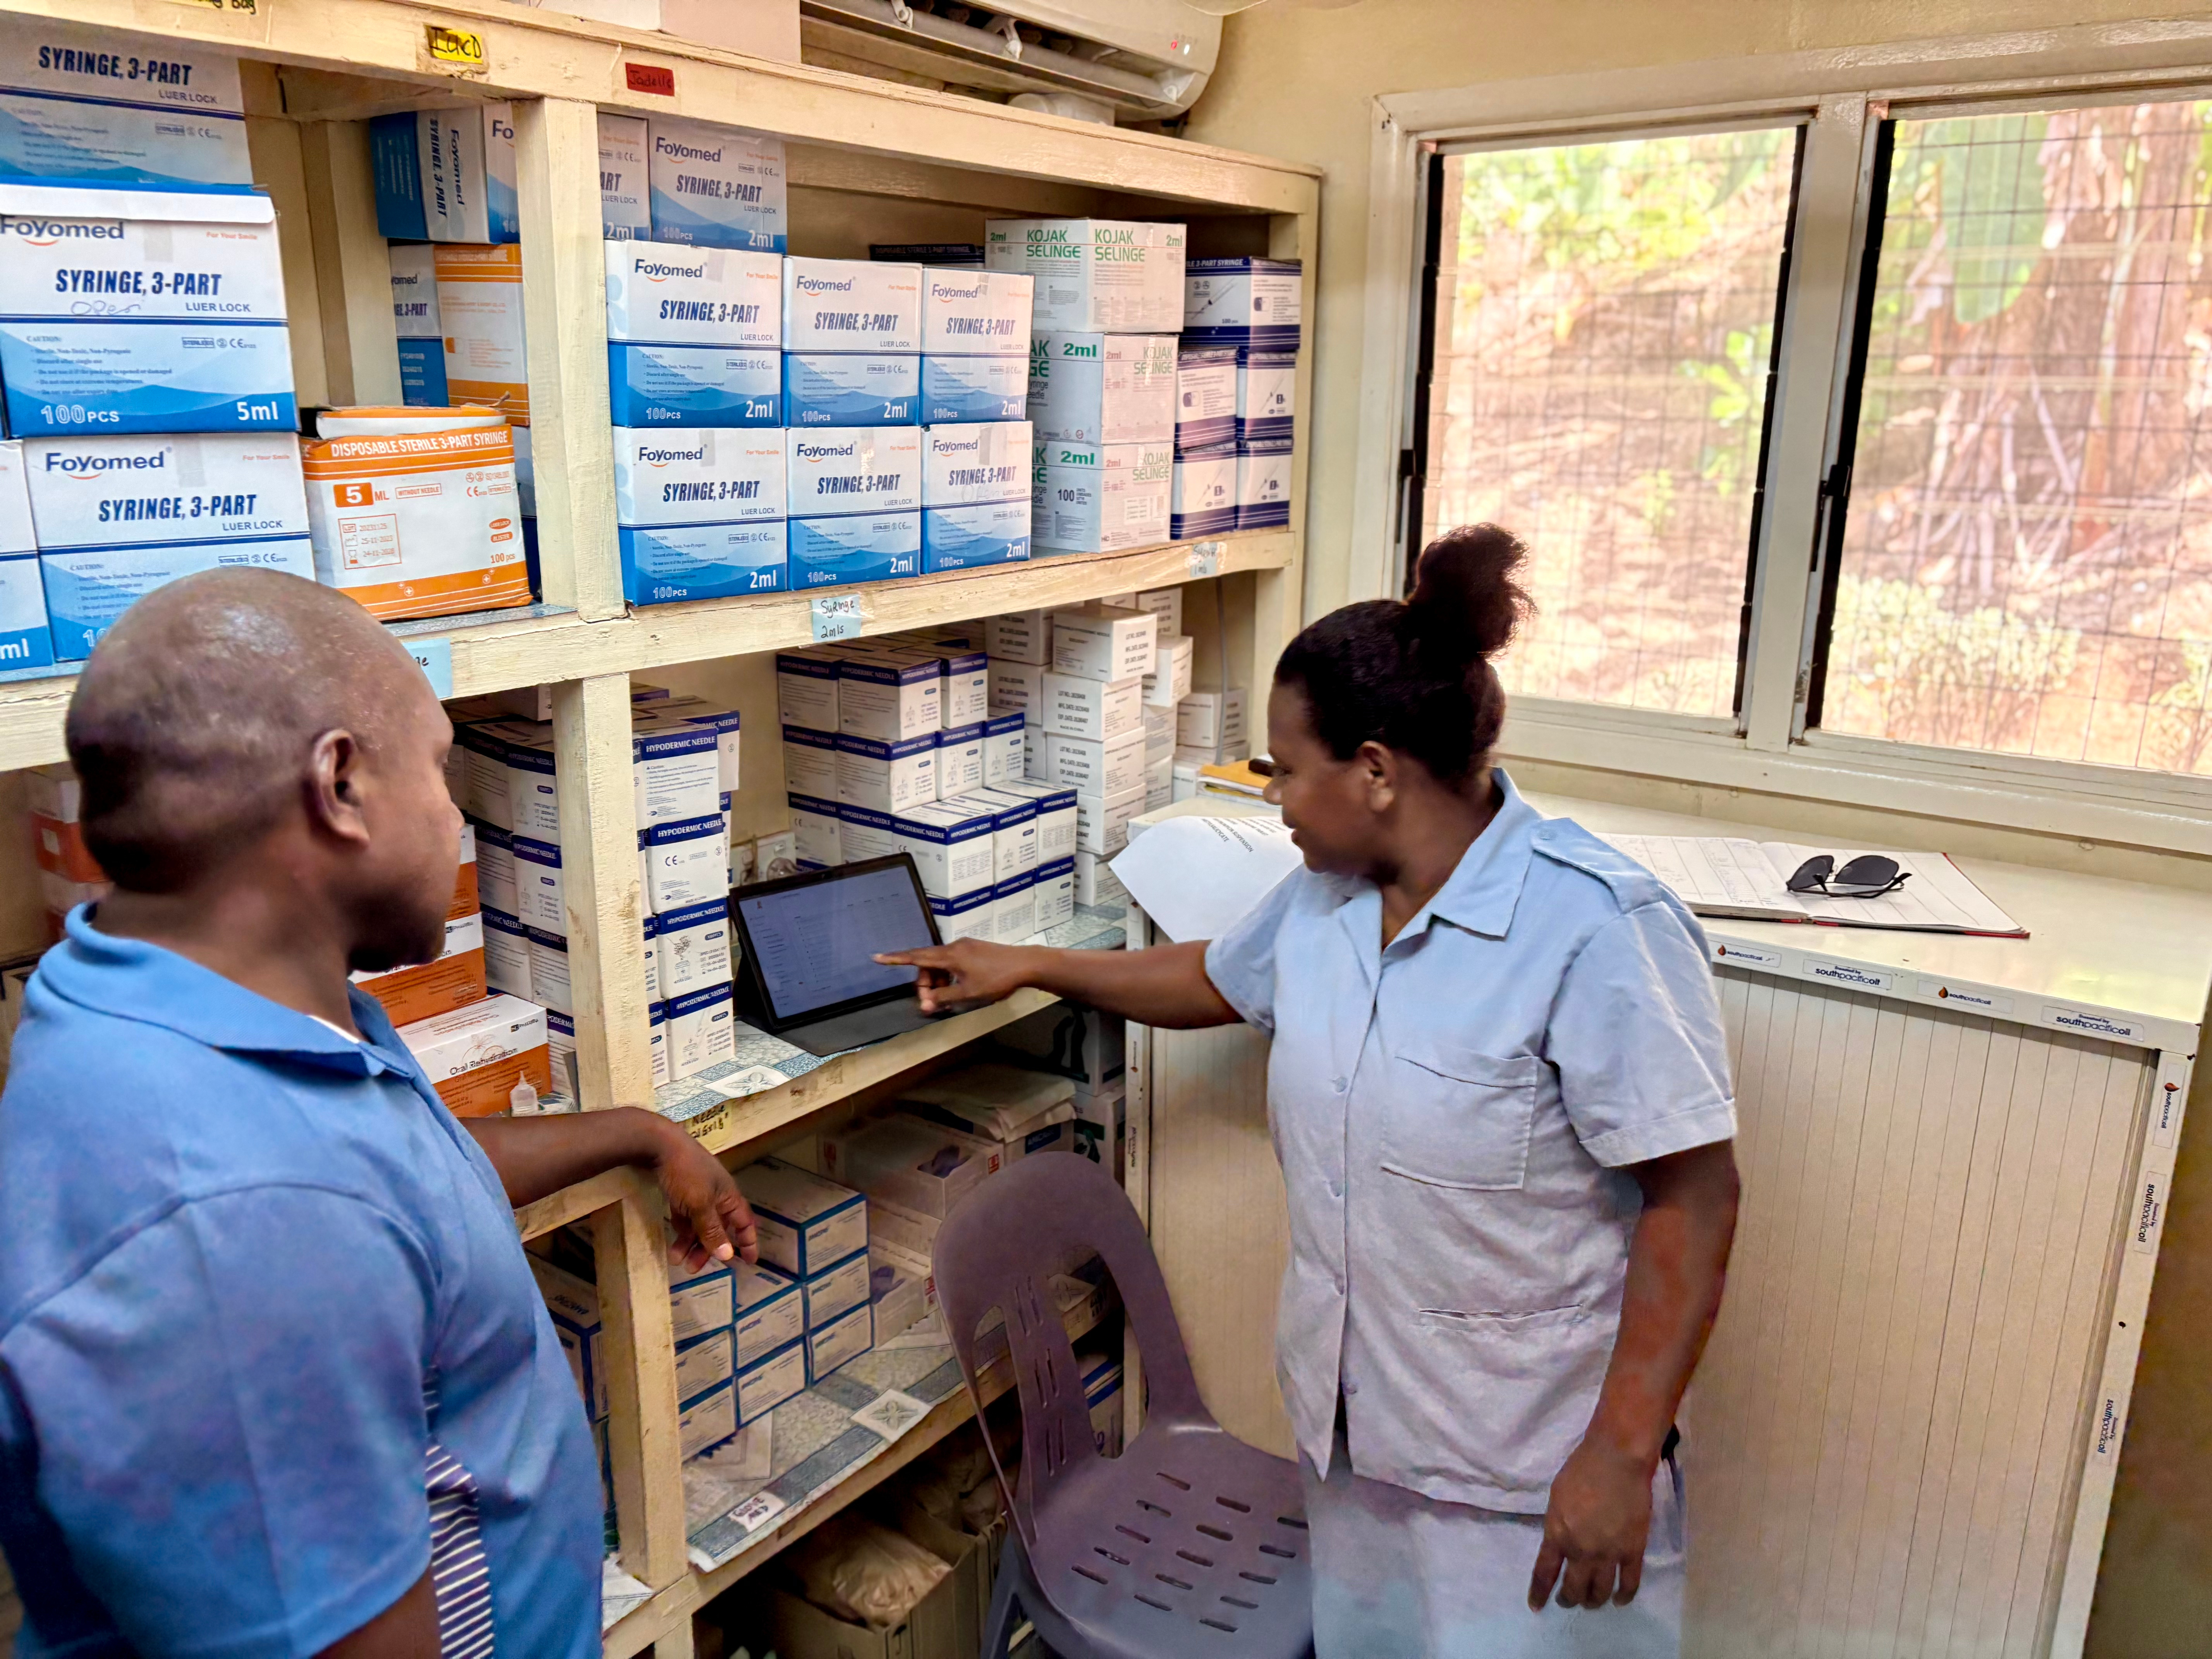
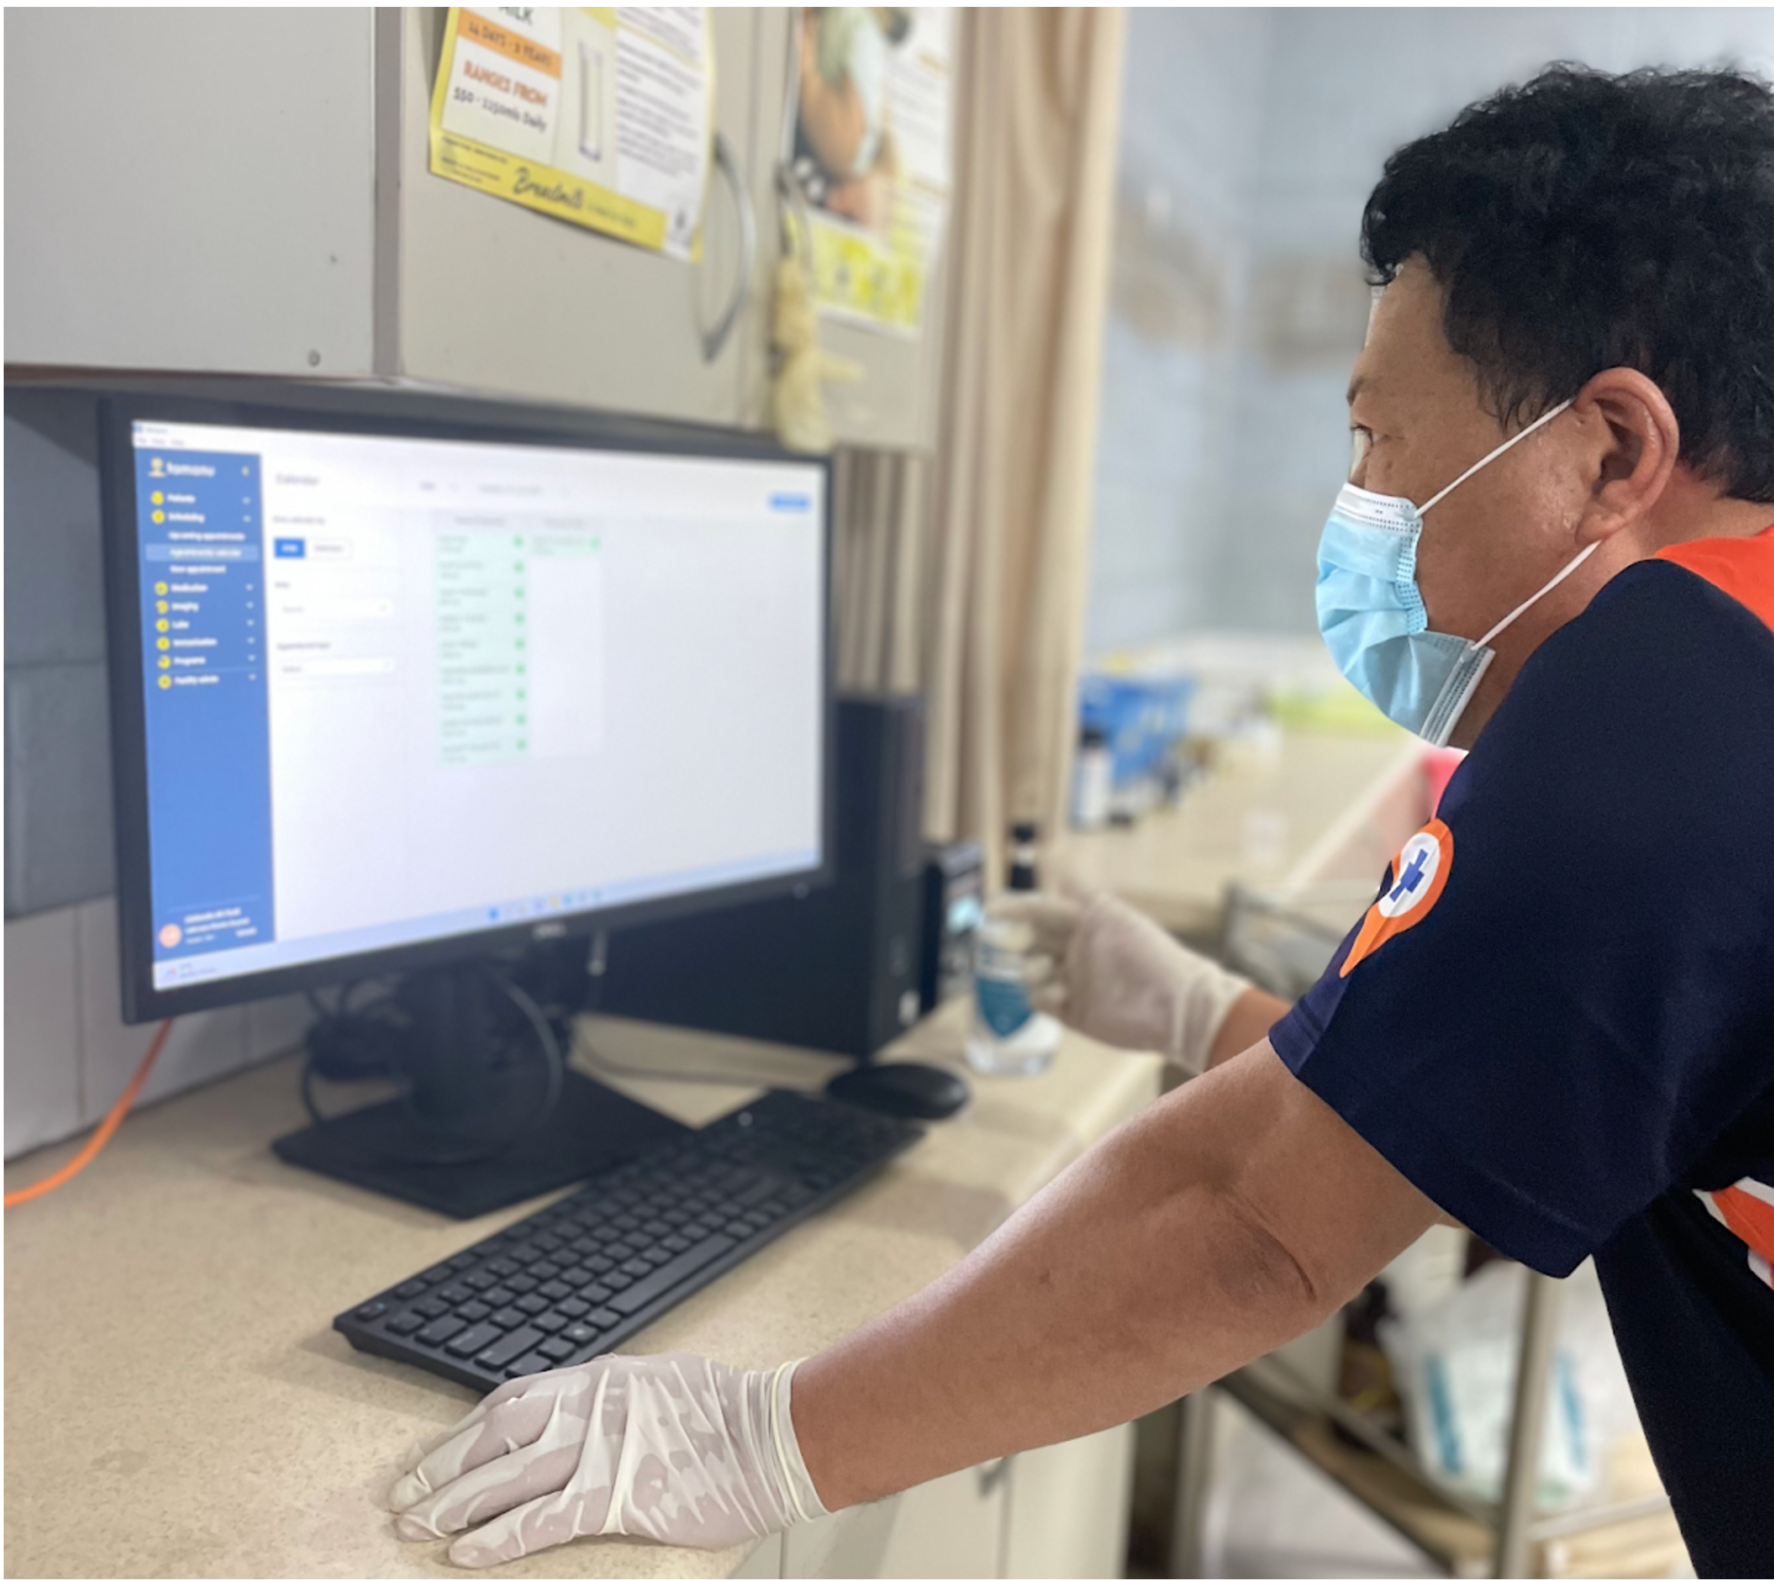
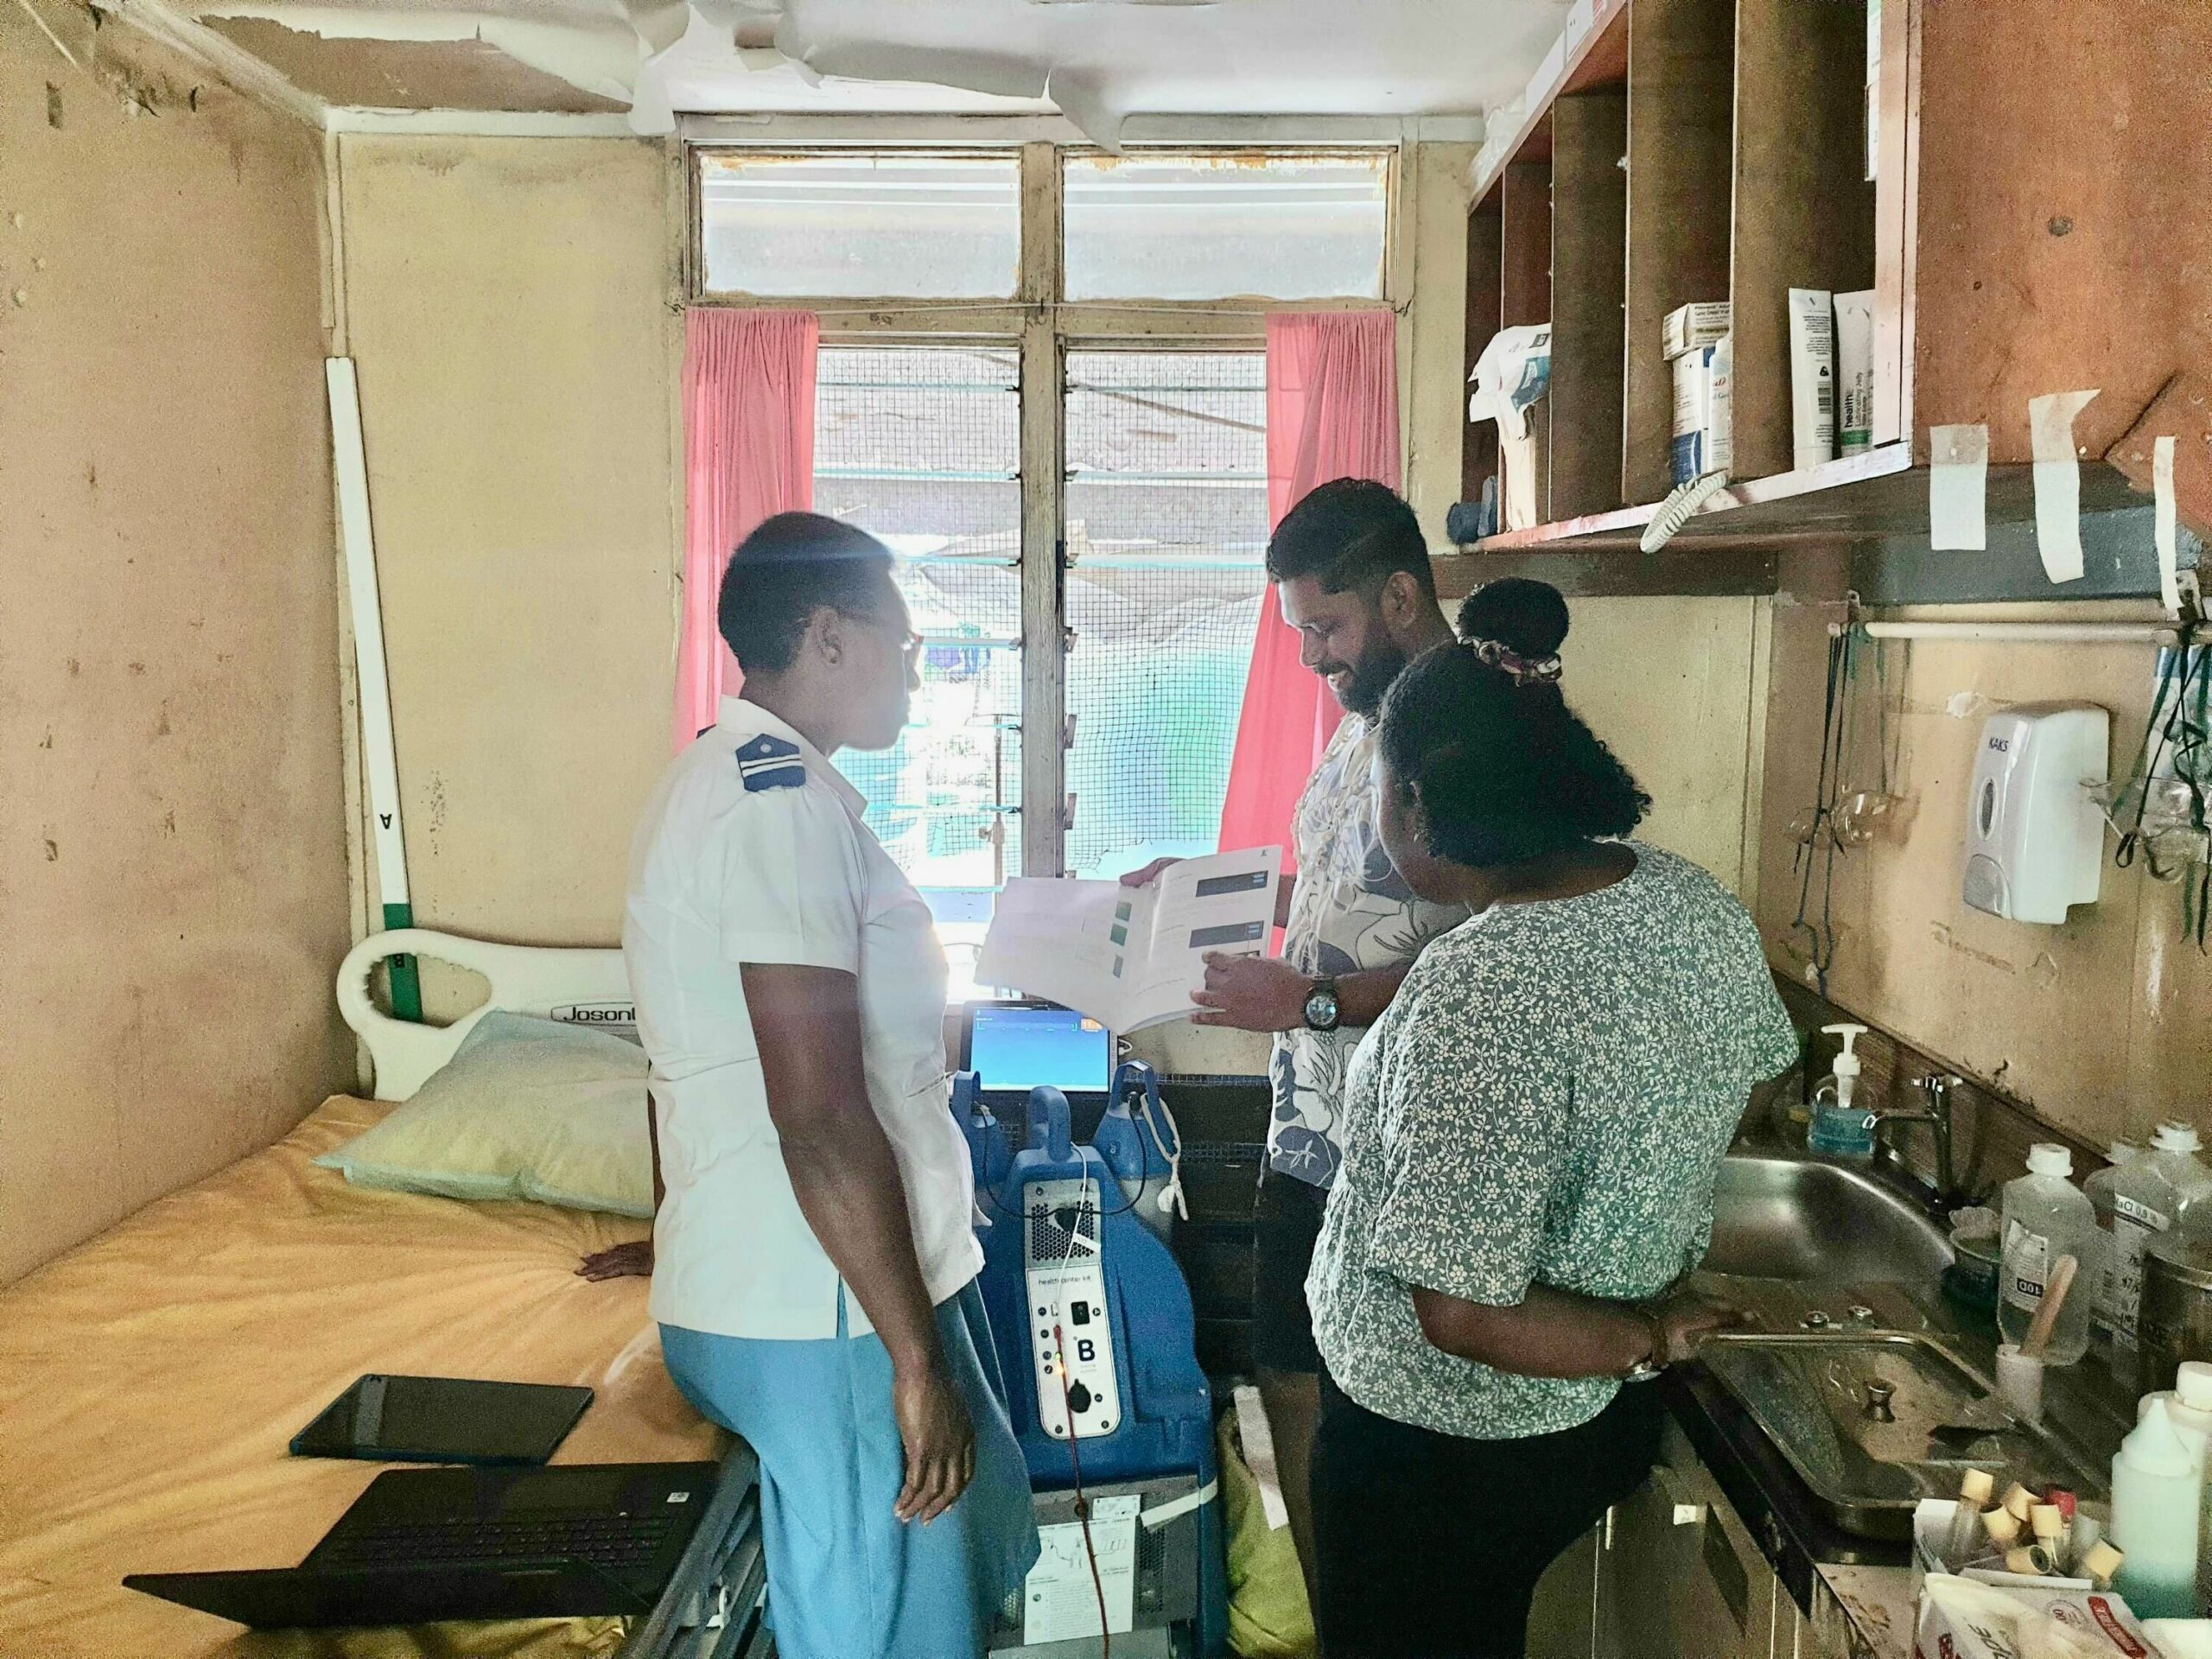
Our data collection app, Tupaia MediTrak is a free and open-source native app for iOS and Android. It is designed to collect cross-sectional or longitudinal data in any setting. Tupaia MediTrak works offline, syncing data whenever the internet becomes available. It has gamification (awarding coconuts and pigs for collecting data) and is free for unlimited users.
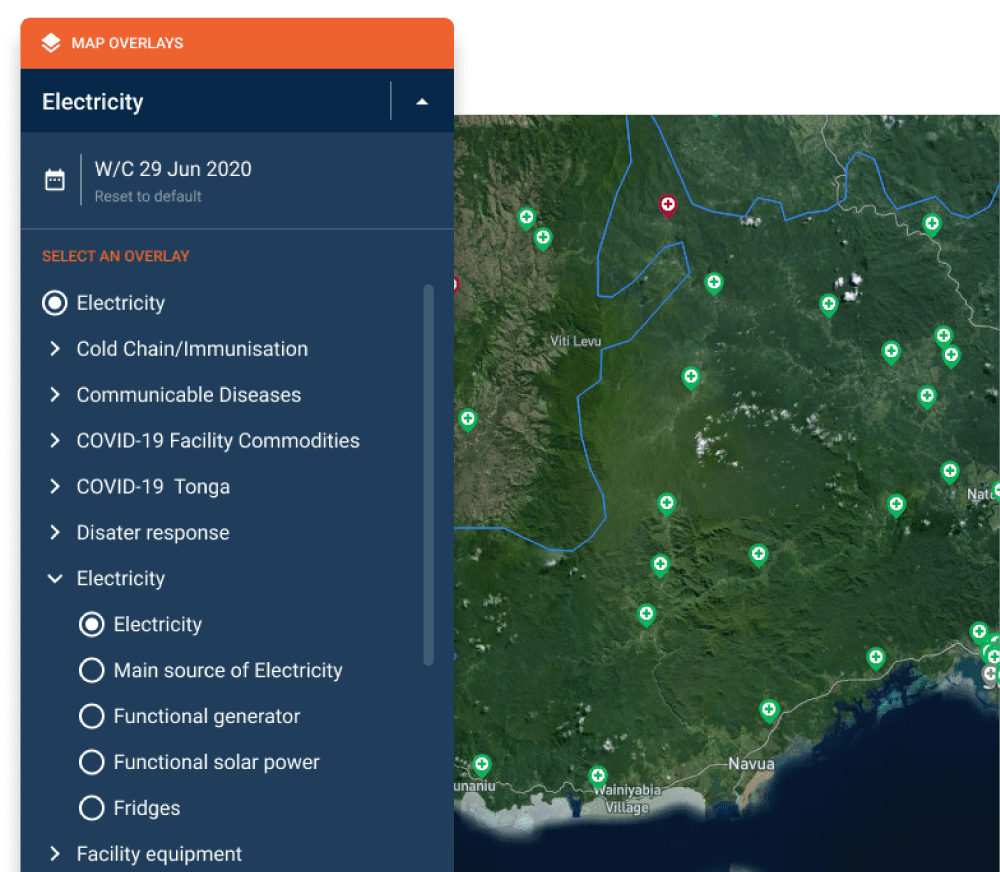
The map
Tupaia allows you to store, edit and manage data but the real magic is in visualising and disseminating it. Our flagship project is Tupaia.org, a mapping-led data visualisation tool harnessing Mapbox and OpenStreetMaps with stunning map overlays and dashboards. Click on any part of the map and watch your data transform – set your project, place, dates and permissions, download and share visualisations and immediately access the raw data behind all of it.
The platform
Data from the app – and other sources – routes into the Tupaia database, which is supported by a microservices architecture. Our scalable platform includes a powerful database, SSO authentication server, data broker, reports builder, visualisation builder and email service. Use our cloud architecture or deploy onto local servers.
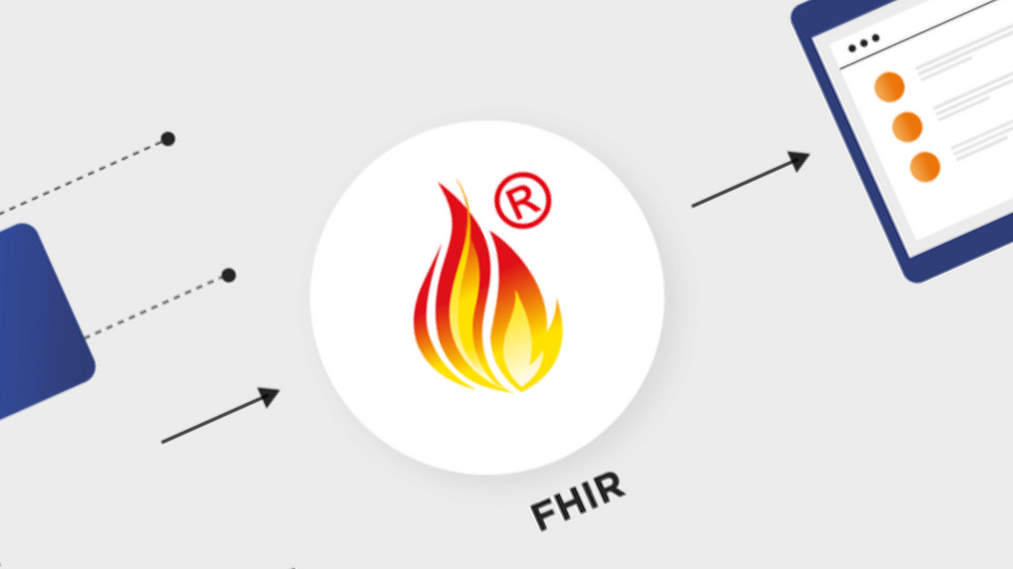
Already using another data collection tool or need to combine data from multiple services? Route data into our platform using existing or customised API integrations in real-time. We already support integrations with DHIS2, Kobo Collect, mSupply, Tamanu and more.
Check out our Tupaia roadmap here.
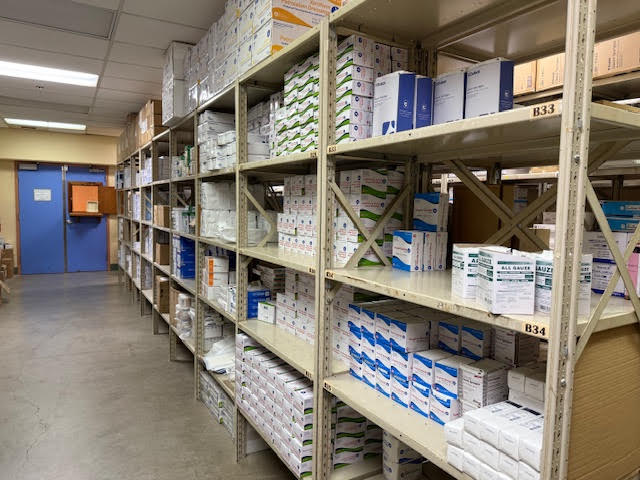
Modules
Generate actionable, realtime data insights.
We are focused on health, education and research – but whatever your project, come and talk to us. We love data and we love doing interesting things with that data.
Features
Enterprise level features in a simple platform.
Powerful data collection, aggregation, analysis, dissemination and visualisation. Trusted by over 25 organisations in 12+ countries.
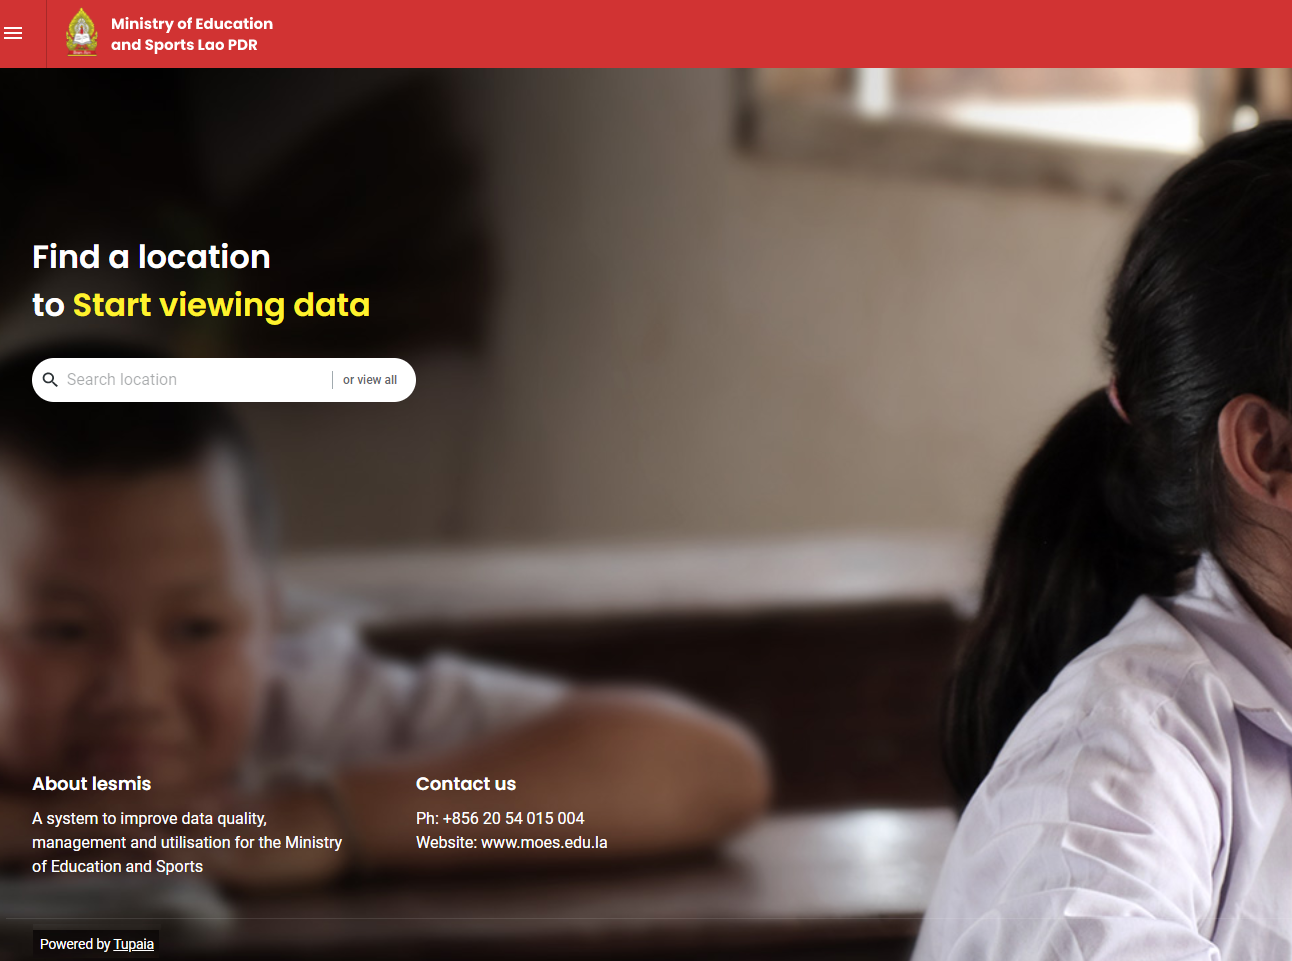
Powered by Tupaia
Bespoke management information systems supported by powerful, stable tools.
We also develop bespoke data systems built on Tupaia’s micro-services architecture. You get a powerful, fully customised information system to meet your organisation or project’s business requirements and workflows, with the confidence that the underlying tools will be stable, scalable, beautiful, supported and maintained. Get your data Powered by Tupaia.
Whatever your data needs, whatever your budget, come and talk to us.


Pricing
Open-source software.
Simple, transparent pricing.
We believe Tupaia should be accessible to everyone. The entire platform and all features are free for health projects in low and middle-income countries. We cost other licences at low, negotiated rates to ensure sustainability.
We also offer a range of other services, including project kick-off, survey design, GIS expertise, API integrations, data configuration, support and maintenance at negotiable rates.
